We focus on many use cases throughout oil and gas.
- Energy trading optimization
- Supply chain optimization
- Origination and portfolio management
- Credit management optimization
- Risk simulations
- Acquisition and divestment simulations
- Asset & resource optimization
We work on optimizing current situations and simulating what-if scenarios. Simulations have been really great for people involved in acquisitions, origination, portfolio management and risk management. In one case, we determined how best to decarbonize the supply chain. We also worked with a client to optimize their natural gas storage. We are simulating the best way for a trading organization to expand into the global LNG market. We are working to help another client optimize how they coordinate food, staff, equipment and helicopters to keep the ~200 offshore wells operational and safe. At another company, we are helping a refinery determine the best hedging strategies for their crude oil purchases. We helped another client optimize their NGL terminal truck rack and inventory.
Every part of oil and gas can benefit from advanced analytics. It is more of a matter of finding organizations that “get it”. The problem is that most people have been burned by the promise of data warehouses, business intelligence and advanced analytics. Everything up to now really has been around giving people knowledge about how their company operates in the past (i.e. you have 4 missing invoices; you have 3000 bbls of crude still sitting in Midland, etc.).
We have a lot of work to do to convince them that they can now use analytics as a business GPS. What do you want to do? What are your constraints? What variables do you use to determine the optimal solution? What determines the best solution? Google Mapilizing your business is very easy and simple once you learn how to do it.
Fortunately, we have a path to allow people to test the water with a 4-6 week proof of concepts where we compare the results that we executed in actuality versus the path that would have been prescribed to them to determine if the software adds value. We have an 80% conversion rate from PoC to full implementation. I have never seen that before but it makes sense. Prescriptive analytics is actionable analytics. Holy cow! My data is actually telling me the best way to meet my objectives.
How do you contrast some of the issues facing Energy/Oil & Gas in the US versus Globally?
Most oil and gas companies in the US operate on a global level or should be thinking about it now that crude can be exported and LNG is globalizing natural gas. The Gulf Coast of Texas and Louisiana is the refining capital of the world. We need to be looking outward in order to grow and expand beyond the US and become the stabilizing force in the world. Russia, Venezuela, Nigeria, Brazil and the Middle East are all not doing so great. The North Sea is declining.
North America can be that consistent source of energy always ready to make up the gap. We have proven with shale that we can scale back when needed and rebound when times improve. It might be painful but we can do it. Prescriptive analytics will give us greater capability to scale up and down in a more efficient manner.
My prediction is that the US will be able to increase its global energy market share using prescriptive analytics in the next 5 years, if everyone would just do as I say and get on board. I have worked in business intelligence and energy trading for 25 years. Prescriptive analytics is what we were waiting for to actually be able to make decisions with confidence in this complex market. Prescriptive analytics will help companies optimize their ability to take advantage of market opportunities but also simulate potential scenarios and determine how they will react before it happens.
How do you plan to expand the prescriptive analytics practice within CGI locally, nationally and globally?
Our healthcare, banking and energy practices have all banded together to create a center of excellence for prescriptive analytics in Lafayette, Louisiana. We are developing local, onshore and offshore prescriptive analytic capabilities. This gives clients access to River Logic experts 24 hours a day and at various cost structures depending on their needs. We also have a River Logic managed service. This allows our customers reduce the costs and internal resources required to have a professional prescriptive analytics practice within their own company. We have a great record for working alongside our clients so that they feel we are part of their organization.
We are constantly sharing models and ideas across the healthcare, banking and energy practices to show each other what is possible. As a side note, one of the great things about River Logic is that it is so intuitively visual, I have a very good understanding of how hospital rooms, staff and equipment are optimized to make sure that the hospital has the right amount of rooms, equipment and staff in the right locations for the number and types of cases it sees.
Prescriptive analytics is very easy to get clients to understand the value after the proof of concept so our overall practice is expanding quite rapidly. It really is a “Crossing the Chasm” situation; I had to go dust off and re-read my copy of the book. We are at the early adopter phase. These companies are going to eat their competition for lunch, the longer this phase lasts.
What unique value and capabilities does River Logic bring to the prescriptive analytics market space?
1. An optimization/simulation software for the business user
River Logic has set the bar for PA market space. We have been reviewing prescriptive analytic software for a year now. They generally fall into two categories. They are either too narrowly focused and only provide decision making capabilities in a very specific case (i.e. natural gas storage) or they are prescriptive analytic framework and require a heavy understanding of R or python.
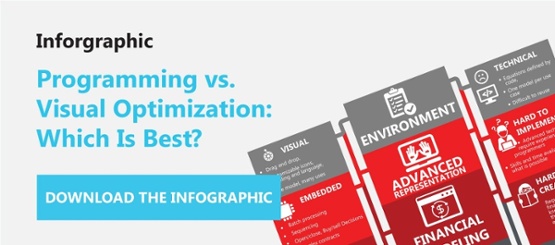
River Logic falls right in the sweet spot. A business user can apply River Logic to any optimization or simulation by dragging, dropping and configuring their scenario. Notice the absence of the terms “developer”, “development”, “programming” and “IT”.
The strength of River Logic is its vision. They understand how business users function. Business users need to get their jobs done. You need to give them the tools so that THEY can do THEIR jobs. Most tools in this space give users a tool that require advanced programming skills which would be great if we lived in a world where everyone had a data scientist in their drawer. But we don’t. We live in a world where business users walk into a meeting and are asked what is the best decision to make? They usually have a day to a week to respond to the question. This is not enough time to find a developer, project manager, database architect, data scientist and develop a software or report that will calculate the correct answer. Instead they go back to their desks and pull up excel and try to come up with the best answer they can essentially using a broken tooth brush and an empty soda can.
2. Optimizing the business user: They shouldn’t have to become programmers to do their jobs
I have seen business users try to get around this problem by becoming advanced VBA programmers. They walk out of the meeting and develop a high powered spreadsheet then they walk into another meeting and the assumptions for the problem change and the code needs to be modified. The originator is now an originator/VBA programmer. 50% of their time is spent working on new deals and the other 50% is spent updating the code in their spreadsheet.
With River Logic I have never had to click more than 10 times to get a model adjusted to a new reality (i.e. added a new asset, changed a reporting structure). River Logic lets business users optimize their decision making capabilities and focus on their jobs.
3. The scale and flexibility of River Logic
The other day, we sat with an energy trading company and modeled one of their natural gas/NGL trading markets. This included multiple natural gas pipelines and capacity contracts, storage facilities and injection and withdrawal rates, natural gas processing and NGL fractionation and all the conversions that go along with that. At first they were insanely skeptical because they kept asking where they put the code. We configured the entire model, ran the optimization and verified the results. During the entire POC, we wrote no code. None.
We had them rebuild the entire model from scratch to train them and prove that no code was written to support the model. The users that were extremely skeptical during the start of the POC were the biggest champions by the end. It felt good.
4. Collaboration through design
River Logic is a very collaborative tool because it is so visual. You draw the scenario on the screen. It’s not like a grid or spreadsheet. So we have trading, scheduling, credit, risk and accounting folks in the room and everyone understands what is going on and can contribute. It was a very collaborative effort. Try to do that with Excel or R or Python. Everyone is lost in 10 minutes.
5. Collaboration through reporting
We also sat with the accounting group to make sure that all the transactions captured by the optimization were recorded against their chart of accounts. The credit group put in their credit limits and hierarchy and the risk folks put their trade book and trade strategies into the model. After the optimization, we ran income statement, balance sheet, credit exposure and PnL reports. Each business function in the trading operation had a report that showed what the results of the optimization would look like from their perspective and verify that their constraints and objectives had been met.
No code. Drag. Drop. Configure. Validate. Run. Repeat.
6. Incredible visualizations
River Logic is integrated with PowerBI. Power BI is a cloud-based business analytics service. Users can run River Logic optimizations and simulations and view the results from a live dashboard or create rich interactive reports with Power BI Desktop and access their data on the go with native Power BI Mobile apps. It’s easy, fast, and free.